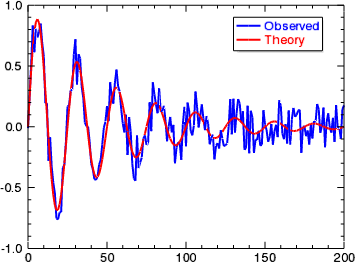
The LEGEND function adds a legend to 2D or 3D line plots, bar plots, contour plots, or vector plots. By default, for line plots, bar plots, and contour plots the NAME property of the graphic item is used for the label within the legend. By default, for vector plots the mean magnitude of the vector field is used for length of the sample vector and for the legend label. In both cases the default label can be overridden with the LABEL property.
; Define the data variables.
theory = SIN(2.0*FINDGEN(201)*!PI/25.0)*EXP(-0.02*FINDGEN(201))
observed = theory + RANDOMU(seed,201)*0.4-0.2
; Display the first plot.
p1 = plot(observed, 'b2', NAME='Observed')
; Display the second plot.
p2 = plot(theory, /OVERPLOT, 'r2', NAME='Theory')
; Add the legend.
l = legend(TARGET=[p1,p2], POSITION=[185,0.9], $
/DATA, /AUTO_TEXT_COLOR)
See the bottom for an example using a vector plot.
graphic = LEGEND([, Keywords=value][, Properties=variable])
Keywords are applied only during the initial creation of the graphic.
[, /DATA] [, /DEVICE] [, /NORMAL] [, /RELATIVE] [, TARGET=variable]
Properties can be set as keywords to the function during creation, or retrieved or changed using the "." notation after creation.
AUTO_TEXT_COLOR, CLIP, COLOR, FONT_NAME, FONT_SIZE, FONT_STYLE, HORIZONTAL_ALIGNMENT, HORIZONTAL_SPACING, LABEL, LINESTYLE, ORIENTATION, POSITION, SAMPLE_ANGLE, SAMPLE_MAGNITUDE, SAMPLE_WIDTH, SHADOW, TEXT_COLOR, THICK, TRANSPARENCY, UNITS, UVALUE, VERTICAL_ALIGNMENT, VERTICAL_SPACING, WINDOW
The LEGEND function returns a reference to the created graphic. Use the returned reference to manipulate the graphic after creation by changing properties or calling methods.
Keywords are applied only during the initial creation of the graphic.
Set this keyword if the input POSITION is in data coordinates. The coordinates will then be automatically converted to normalized coordinates before inserting the legend into the annotation layer.
Set this keyword if the input POSITION is in device coordinates (pixels). The coordinates will then be automatically converted to normalized coordinates before inserting the legend into the annotation layer.
Set this keyword if the input POSITION is in normalized ( [0, 1] ) coordinates (the default).
Set this keyword to indicate that the input arguments are specified in normalized [0,1] coordinates, relative to the axis range of the TARGET's dataspace. If the TARGET keyword is not specified, then setting /RELATIVE is the same as setting /NORMAL.
Note: When using /RELATIVE, even though the coordinates are relative to the TARGET's dataspace, the graphic is added to the annotation layer, not to the dataspace.
Set this keyword to the visualization to which the legend should be associated. If TARGET is not specified any currently selected objects will be used. If no suitable targets are found no legend will be created.
Set this property to true (1) to draw the text labels using the same color as the associated plot lines. If this property is set then the TEXT_COLOR property is ignored. The default is false (0).
Set this property to 1 to clip portions of the graphic that lie outside of the dataspace range, or to 0 to disable clipping. The default is 1. This property is ignored unless the DATA property is set.
Set this property to a string or RGB vector that specifies the color of the outline.
The horizontal alignment of the legend with respect to the position. This is a value between 0 and 1 where 1 specifies right-aligned (the default). This can also be a string with the following options: 'LEFT', 'CENTER', or 'RIGHT'.
The horizontal spacing between items in normalized units.
Set this property to an integer or string specifying the line style for the outline. The allowed values are:
| Index | String (case insensitive) |
|---|---|
| 0 | 'solid' or '-'(dash) |
| 1 | 'dot' or ':'(colon) |
| 2 | 'dash' or '--' (double dashes) |
| 3 | 'dash dot' or '-.' |
| 4 | 'dash dot dot dot' or '-:' |
| 5 | 'long dash' or '__' (double underscores) |
| 6 | 'none' or ' ' (space) |
The orientation of the legend. Setting this value to one (1) denotes a horizontal legend, the default is a vertical legend.
Set this property to set the location of the legend. POSITION is specified as a 2 element vector: [X, Y], defining the upper left corner of the legend. If the DEVICE property is set, the units are given in device units (pixels).
Set this property to true (1) to turn on the legend shadow, or to false (0) to turn off the shadow. The default value is 1.
Set this property to a value between 0 and 10 that specifies the line thickness of the outline. A thickness of 0 displays a thin hairline on the chosen device. The default value is 1.
An integer from 0-100 giving the percent transparency.
Set this property to an IDL variable of any data type.
The vertical alignment of the legend with respect to the position. This is a value between 0 and 1 where 1 specifies top aligned (the default). This can also be a string with the following options: 'TOP', 'CENTER', or 'BOTTOM'.
The vertical spacing between items in normalized units.
This property retrieves a reference to the WINDOW object which contains the graphic.
The following properties apply to the individual legend items within the legend. These properties can be set on initial creation of the legend, and will be passed down to all of the newly-created legend items. The properties can also be set on a legend item after creation by retrieving the legend item and then using the "." notation.
Set this property equal to a string specifying the IDL or system font. The default value is “Helvetica”.
Set this property equal to an integer specifying the font size. The default value is 16 points.
A string or integer containing the font style. Allowed values are:
|
Integer |
String |
Resulting Style |
|---|---|---|
|
0 |
"Normal" or "rm" |
Default (roman) |
|
1 |
"Bold" or "bf" |
Bold |
|
2 |
"Italic" or "it" |
Italic |
|
3 |
"Bold italic" or "bi" |
Bold italic |
Set this property to a string giving the label for the legend item. If this property is set then the default label will not be used. Set this property to an empty string to go back to using the default label.
You can add Greek letters and mathematical symbols using a TeX-like syntax. These symbols need to be enclosed within a pair of "$" characters. See Adding Mathematical Symbols and Greek Letters to the Text String for details on the available symbols.
The angle of the sample line or arrow, in degrees. The default value is zero, which gives a horizontal line for line plots, and a right-pointing arrow for vector plots.
For legend items for vector plots, set this property to either a case-insensitive string or a floating-point number giving the length of the sample vector. Possible values are:
The arrow displayed in the legend is scaled to match the chosen length, relative to the maximum magnitude of the vector plot. This property is only used for legend items for vector plots, and is ignored for all other legend items.
Note: If the LABEL property is set, then the SAMPLE_MAGNITUDE will still be used to scale the length of the sample arrow, but will not be used to label the legend item. For example, if your vector data was in "miles per hour" but you wanted to display the length in "km/hr", you might set the SAMPLE_MAGNITUDE to 62, but then set the LABEL to "100 km/hr".
The width of the line sample, in normalized units. The default value is 0.15.
Set this property to a string or RGB vector that specifies the color of the text.
Set this property to a string giving the units for the vector plot. This string will then be appended to the sample magnitude label in the legend item. If the LABEL property is set then this property is ignored. This property is only used for legend items for vector plots, and is ignored for all other legend items.
You can add Greek letters and mathematical symbols using a TeX-like syntax. These symbols need to be enclosed within a pair of "$" characters. See Adding Mathematical Symbols and Greek Letters to the Text String for details on the available symbols.
Once a legend is created, the individual legend items can be retrieved using standard array indexing. Once a legend item is retrieved, you can change any of the properties on that legend item. For example:
t = FINDGEN(101)/10
p1 = PLOT(SIN(t), '-ro')
p2 = PLOT(COS(t), '-go', /OVERPLOT)
leg = LEGEND(TARGET=[p1,p2])
; Retrieve the first and second legend items, change the labels
leg[0].label = "Sin"
leg[1].label = "Cos"
HELP, leg[0]
HELP, leg[1]
HELP, leg[0:1]
IDL prints:
<Expression> LEGENDITEM <19018>
<Expression> LEGENDITEM <19019>
<Expression> OBJREF = Array[2]
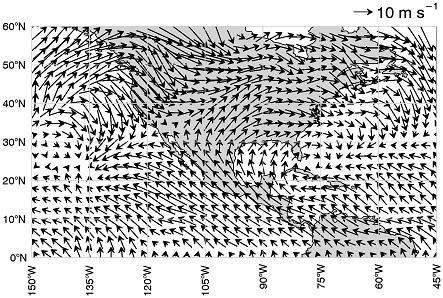
This example demonstrates how to add a legend to a vector plot.
; Set up the map projection, grid, and continents.
m = Map('Equirectangular', LIMIT=[0,-150,60,-45], $
LABEL_POSITION=0, COLOR='light gray', LABEL_COLOR='black')
m1 = MapContinents(FILL_COLOR='light gray')
; Read the wind data, create a vector plot
RESTORE, FILEPATH('globalwinds.dat', $
SUBDIR=['examples','data'])
vec = Vector(u, v, x, y, /OVERPLOT, LENGTH_SCALE=2)
; Add the legend
l = Legend(SAMPLE_MAGNITUDE=10, UNITS='$m s^{-1}$', $
POSITION=m.MapForward(-45,61), /DATA, $
VERTICAL_ALIGNMENT='bottom')
Note that we use the MapForward method to determine the position of the legend in the upper right of the map. Also note that we use the SAMPLE_MAGNITUDE property to override the default sample vector length.
|
8.0 |
Introduced |
|
8.1 |
Added the UVALUE property. The THICK property was changed to accept a value between 0 and 10. |
| 8.2 | Added support for legends for vector plots. Added Legend Item properties: LABEL, SAMPLE_ANGLE, SAMPLE_MAGNITUDE, UNITS. |
LEGEND LEGEND LEGEND LEGEND LEGEND LEGEND LEGEND LEGEND LEGEND LEGEND LEGEND LEGEND LEGEND LEGEND LEGEND LEGEND LEGEND LEGEND LEGEND LEGEND LEGEND LEGEND LEGEND LEGEND LEGEND LEGEND LEGEND LEGEND LEGEND LEGEND LEGEND LEGEND LEGEND LEGEND LEGEND LEGEND LEGEND LEGEND LEGEND LEGEND LEGEND LEGEND LEGEND LEGEND LEGEND LEGEND LEGEND LEGEND LEGEND LEGEND LEGEND LEGEND LEGEND LEGEND LEGEND LEGEND LEGEND